Matplotlib - Step Plot
A step plot displays vertical lines that connect the data points to a horizontal baseline. A step plot enables to see the point on the x-axis when a change in the y-axis measure occurs.
The matplotlib.pyplot.step() function makes a step plot.
Syntax
matplotlib.pyplot.stepplot(x, y, [fmt], where='pre')
Parameters
x |
Required. Specify 1D sequence of x positions. It is assumed, but not checked, that it is uniformly increasing. array-like. |
y |
Required. Specify 1D sequence of y levels.array-like. |
[fmt] |
Optional. Specify a format string, e.g. 'g' for a green line. |
where |
Optional. It takes value from {'pre', 'post', 'mid'}. Default is 'pre'. This defines where the steps should be placed:
|
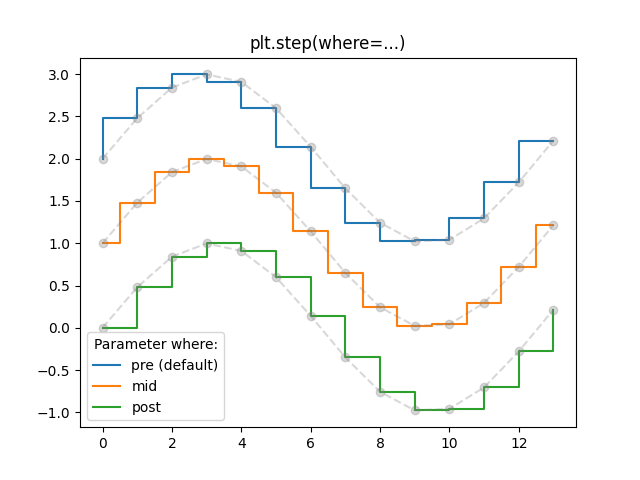
Example: step plot
In the example below, a step plot of three different curves are drawn. Along with this, three line plots are also drawn to illustrate the effect of where parameter of the step plot.
import matplotlib.pyplot as plt
import numpy as np

x = np.arange(14)
y = np.sin(x / 2)

fig, ax = plt.subplots()
ax.set_title('plt.step(where=...)')

#drawing step plot
ax.step(x, y+2)
ax.step(x, y+1, where='mid')
ax.step(x, y, where='post')

#indicating where
ax.plot(x, y + 2, 'o--', color='grey', alpha=0.3)
ax.plot(x, y + 1, 'o--', color='grey', alpha=0.3)
ax.plot(x, y, 'o--', color='grey', alpha=0.3)

labels = ['pre (default)', 'mid', 'post']
ax.legend(title='Parameter where:', labels=labels)

plt.show()
The output of the above code will be:
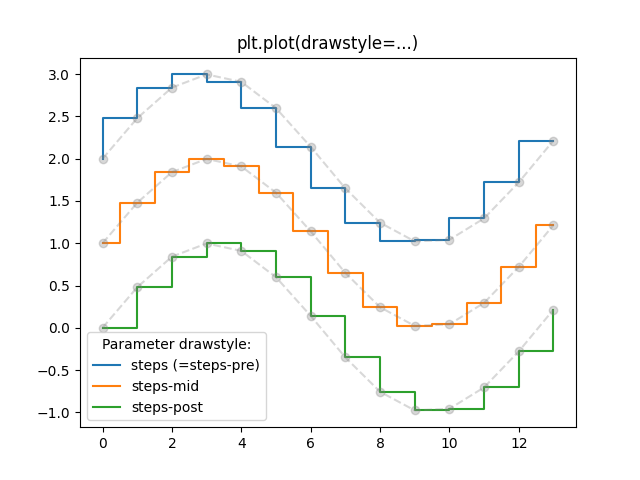
Example: step plot using pyplot.plot
The same can also be achieved without using step() function. For this, we have to use drawstyle parameter of pyplot.plot.
import matplotlib.pyplot as plt
import numpy as np

x = np.arange(14)
y = np.sin(x / 2)

fig, ax = plt.subplots()
ax.set_title('plt.plot(drawstyle=...)')

#drawing plots with different drawstyle
ax.plot(x, y+2, drawstyle='steps')
ax.plot(x, y+1, drawstyle='steps-mid')
ax.plot(x, y, drawstyle='steps-post')

#indicating drawstyle
ax.plot(x, y + 2, 'o--', color='grey', alpha=0.3)
ax.plot(x, y + 1, 'o--', color='grey', alpha=0.3)
ax.plot(x, y, 'o--', color='grey', alpha=0.3)

labels = ['steps (=steps-pre)', 'steps-mid', 'steps-post']
ax.legend(title='Parameter drawstyle:', labels=labels)

plt.show()
The output of the above code will be: