Matplotlib - 3D Plotting
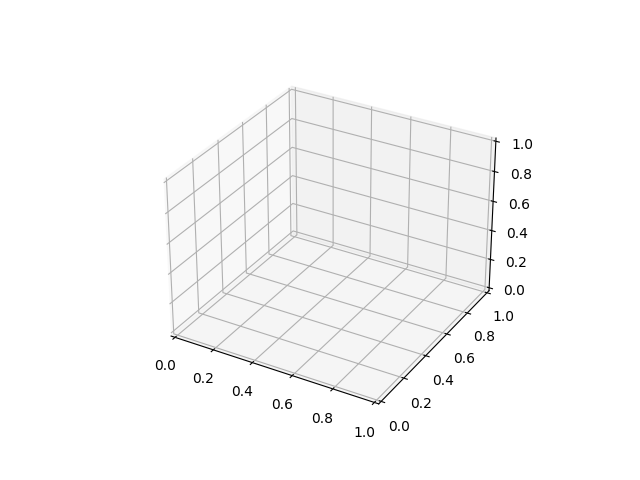
Matplotlib supports three-dimensional plotting. A three-dimensional axes can be created by passing the keyword projection='3d' to any of the normal axes creation routines.
Note: Prior to Matplotlib 3.2.0, it was necessary to explicitly import the mpl_toolkits.mplot3d module to make the '3d' projection to the Figure.add_subplot.
Syntax
import matplotlib.pyplot as plt
fig = plt.figure()
ax = fig.add_subplot(111, projection='3d')
With the above syntax, three-dimensional axes are enabled and data can be plotted in 3 dimensions.

Example: drawing 3D line plot
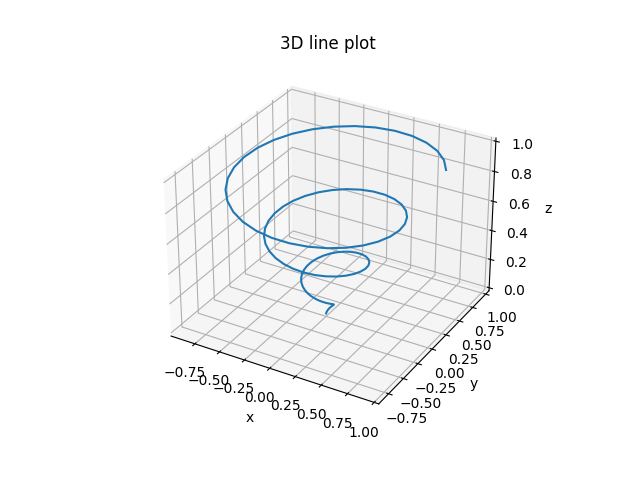
In the example below, a 3D line plot is created.
import matplotlib.pyplot as plt
import numpy as np

z = np.linspace(0, 1, 100)
x = z*np.sin(20*z)
y = z*np.cos(20*z)

fig = plt.figure()
ax = fig.add_subplot(111, projection='3d')
ax.set_title('3D line plot')
ax.set_xlabel('x')
ax.set_ylabel('y')
ax.set_zlabel('z')

#drawing line plot
ax.plot(x, y, z)

plt.show()
The output of the above code will be:


